🏦 How Institutional Traders Operate
Learn the strategies big banks, hedge funds, and market makers use to dominate the markets
🎯 Why This Matters
Retail traders lose because they trade AGAINST institutions. The smart money isn't buying breakouts—they're selling to you at the top. They're not panic selling the bottom—they're accumulating your shares.
This guide reveals exactly how institutional traders operate, where they buy and sell, and the strategies they use to extract billions from retail traders. Once you understand their playbook, you can trade WITH them instead of against them.
⚡ Key Insight: Institutions don't trade like you. They use algorithms, dark pools, hidden orders, and sophisticated execution strategies that most retail traders never see.
🏛️ Market Makers: The House Always Wins
Market makers are firms designated to provide liquidity by continuously quoting both buy and sell prices. Think of them as the "house" in a casino—they profit from the spread, not from directional bets.
How Market Makers Profit
📈 The Bid-Ask Spread
Example: Stock trading at $100
- Bid: $99.95 (what market maker pays to BUY from you)
- Ask: $100.05 (what market maker charges to SELL to you)
- Spread: $0.10 per share
On 1 million shares, that's $100,000 in risk-free profit just from the spread.
🔄 Delta Hedging
Market makers sell you options but DON'T want directional risk. They immediately hedge by buying/selling the underlying stock.
Example: You buy 10 AAPL $200 calls (delta 0.50)
- Market maker sells you the calls (+$5,000 credit)
- Immediately buys 500 shares of AAPL to hedge (delta neutral)
- Profits from the premium, doesn't care if AAPL goes up or down
When you see massive volume on options but the stock barely moves, that's market makers hedging. Look for sudden price acceleration when they run out of hedge capacity—this creates explosive moves.
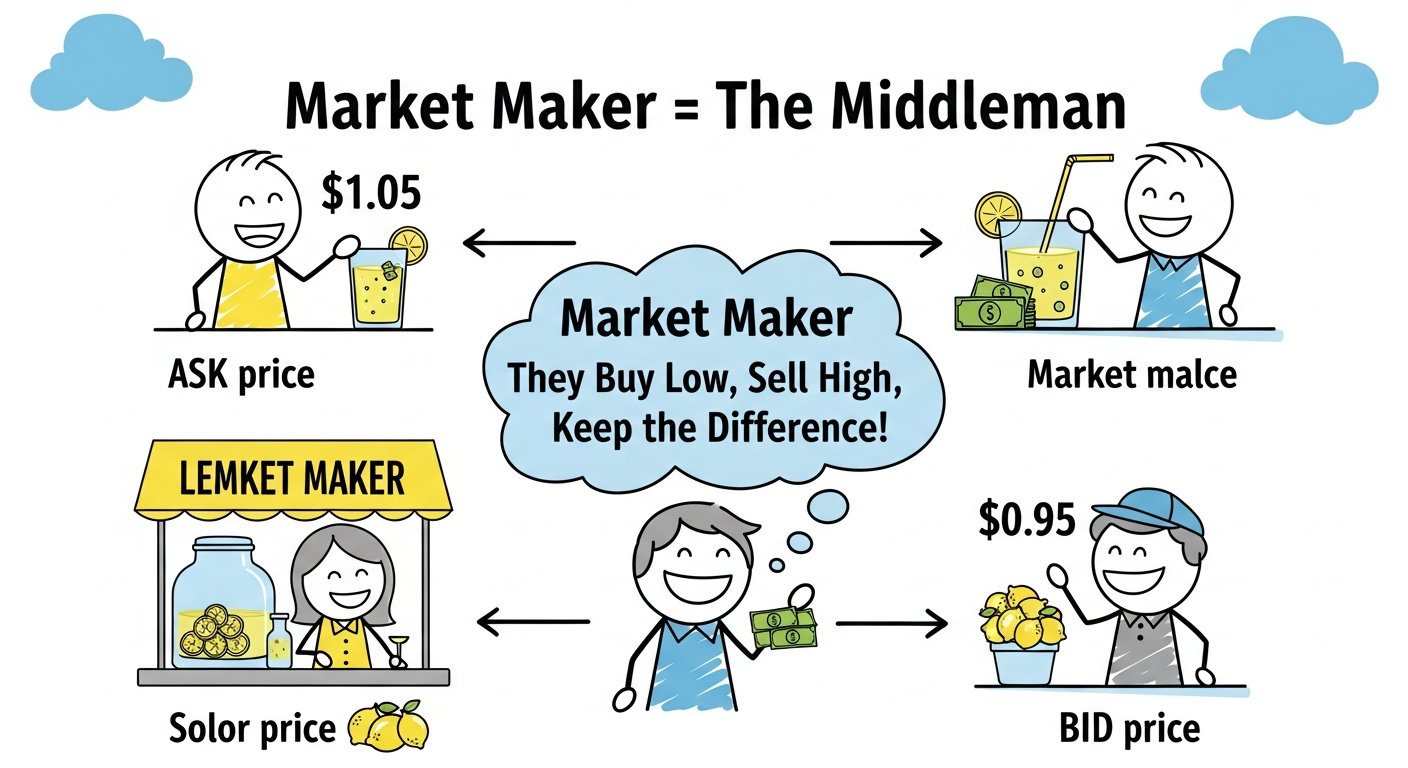
Market makers are like the middleman - they buy low and sell high, keeping the difference as profit!
🌑 Dark Pools: Where Big Money Hides
Dark pools are private exchanges where institutions trade large blocks WITHOUT showing their orders to the public market. Why? To avoid moving the price before they finish accumulating or distributing.
Why Institutions Use Dark Pools
- Price Protection: A 10 million share buy order on the open market would spike the price. In a dark pool, it's hidden.
- No Information Leakage: Other algos can't front-run their orders
- Better Fills: Can execute at midpoint between bid-ask
📊 Real Dark Pool Example
Scenario: Hedge fund wants to buy 5 million shares of NVDA
Public Market Approach (BAD):
- Places 5M share buy order on NASDAQ
- HFT algorithms detect the order instantly
- Price jumps $2 before order fills
- Hedge fund pays $10M more than necessary
Dark Pool Approach (SMART):
- Routes order to dark pool (e.g., "SIGMA-X")
- Order hidden from public
- Fills slowly over 3 hours at VWAP
- No price impact, saves $10M
How to Spot Dark Pool Activity
🔍 Signals of Dark Pool Prints
- Large block trades printed "off-hours" (before 9:30am or after 4pm)
- Trades at exact midpoint between bid-ask
- Unusual volume spikes with no price movement
- Repeated prints at same price level (institutions layering in)
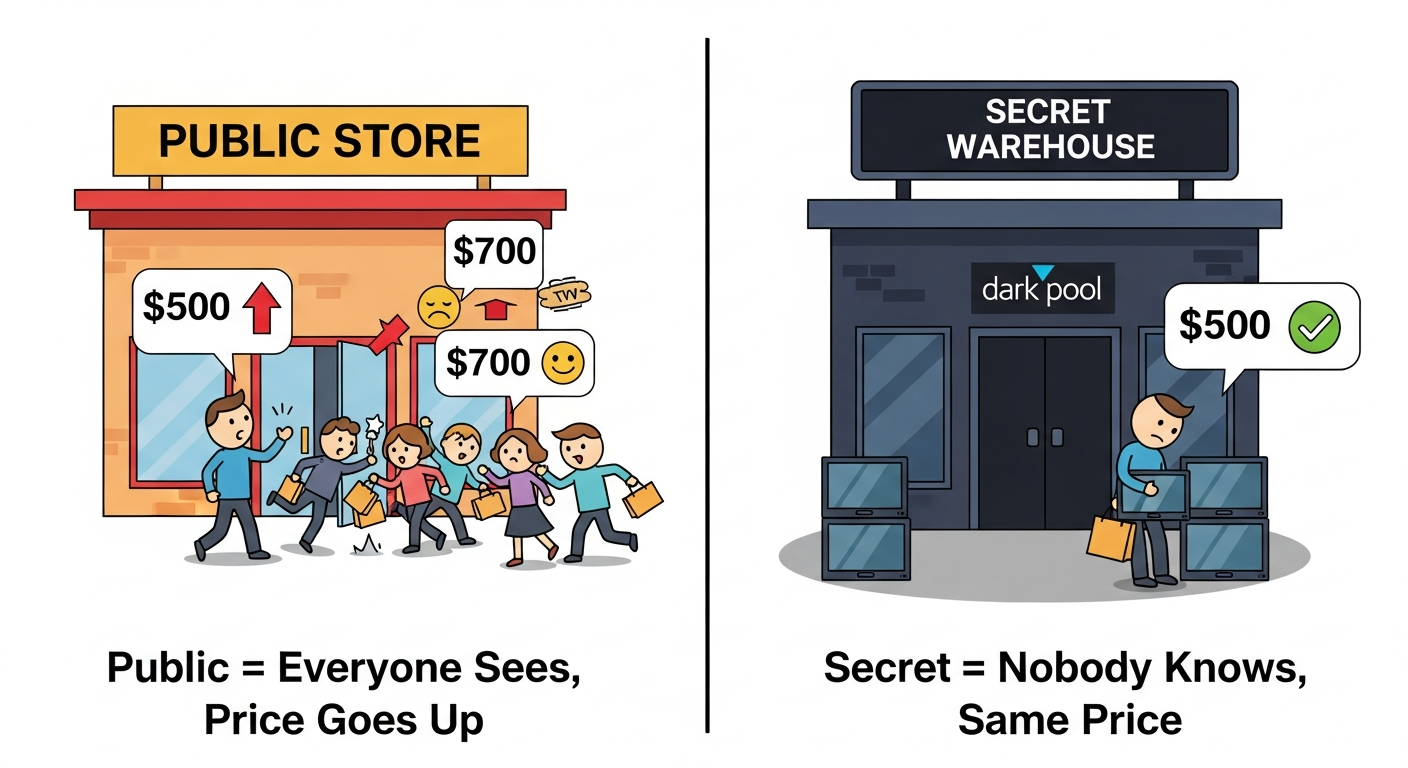
Public market = Everyone sees your order and price goes up. Dark pool = Secret buying, nobody knows, price stays the same!
📊 VWAP & TWAP: Algorithmic Execution Strategies
Institutions don't dump 10 million shares in one order. They use algorithms to execute slowly over time, minimizing market impact.
⏰ TWAP (Time-Weighted Average Price)
Strategy: Split order evenly across time
Example: Sell 1 million shares over 4 hours
- 9:30 - 10:30am: Sell 250,000 shares
- 10:30 - 11:30am: Sell 250,000 shares
- 11:30 - 12:30pm: Sell 250,000 shares
- 12:30 - 1:30pm: Sell 250,000 shares
Goal: Execute steadily, avoid moving price
📈 VWAP (Volume-Weighted Average Price)
Strategy: Execute based on volume patterns
Example: Most volume happens at open/close
- 9:30 - 10am: Sell 400,000 shares (high volume)
- 10am - 2pm: Sell 200,000 shares (low volume)
- 2pm - 4pm: Sell 400,000 shares (high volume)
Goal: Blend in with natural volume flows
💰 Why This Matters for Retail
Morning Drift: Ever notice how stocks gap up at open, then slowly fade all day? That's VWAP sellers distributing into strength.
Strategy: Don't chase morning pumps. Wait for VWAP sellers to finish (usually by 11am), then look for reversal.
- Price above VWAP = bullish (buyers in control)
- Price below VWAP = bearish (sellers in control)
- Price rejecting VWAP = strong support/resistance
- Multiple touches of VWAP = institutional absorption
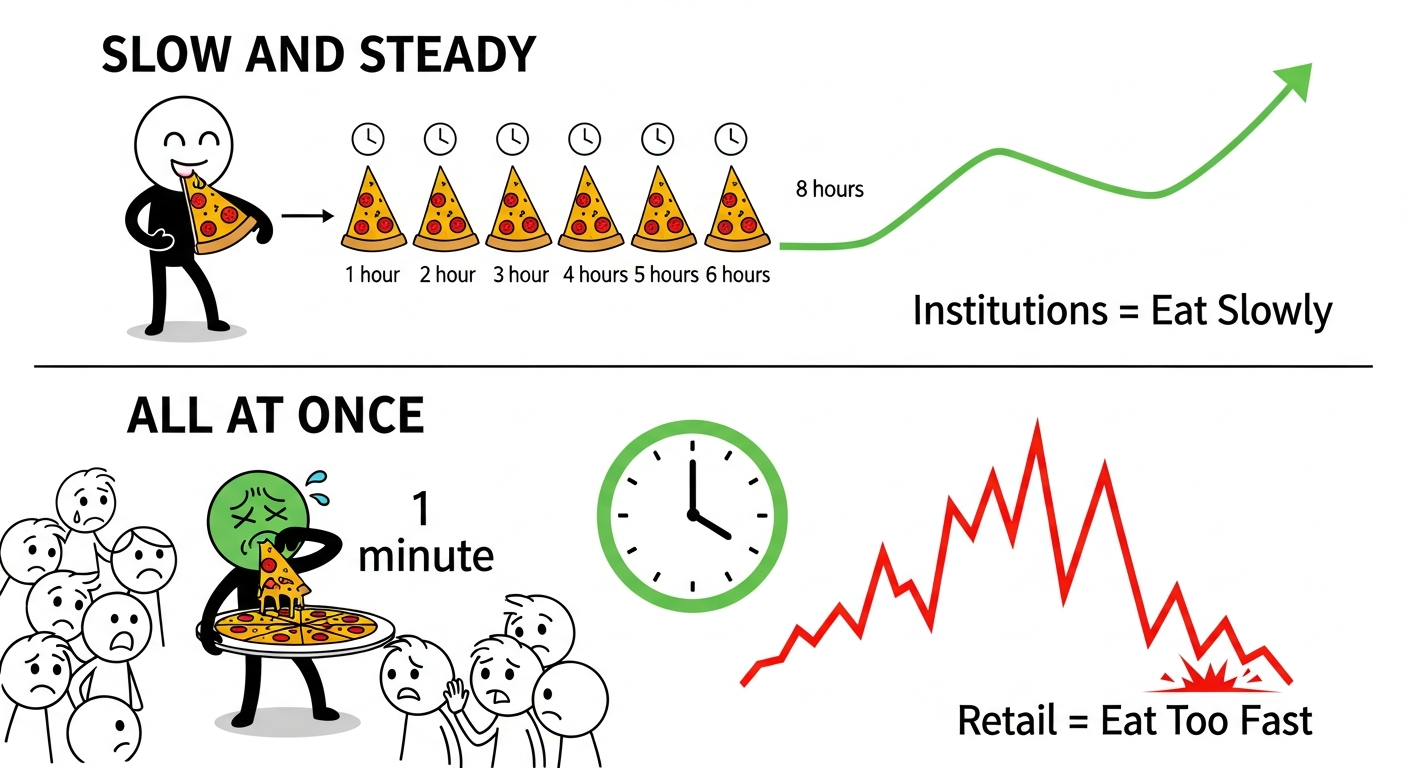
Like eating pizza: Institutions buy slowly all day (steady and smart). Retail buys everything at once (causes price to spike then crash)!
🧊 Iceberg Orders: Hidden Size
An iceberg order shows only a small portion of the total order size. The rest is "hidden" below the surface, just like an iceberg.
How Iceberg Orders Work
📋 Example Scenario
Institution wants to buy 500,000 shares
Visible Order: 5,000 shares at $100.00
Hidden Size: 495,000 shares
What Happens:
- Order book shows only 5,000 shares
- As shares fill, order automatically refreshes to 5,000
- Continues refreshing until all 500,000 shares filled
- Other traders see "unlimited supply" at $100.00
🔍 How to Spot Iceberg Orders
Level 2 Signals
- Order keeps refreshing at the same price level
- Large volume executed but order size stays small
- Price stalls at specific level despite heavy volume
- Time & Sales shows repeated prints at same price
If Price Can't Break Through: That's an iceberg. Don't fight it. The institution has unlimited size.
If Price Finally Breaks: Iceberg is filled. Expect explosive move as resistance removed.
📦 Accumulation & Distribution: The Wyckoff Method
This is THE most important concept. Institutions don't buy breakouts—they accumulate BEFORE the move, then distribute at the top while retail buys.
🟢 Accumulation Phase (Smart Money Buying)
Phase 1: Preliminary Support (PS)
After a downtrend, price starts finding buyers. Volume increases on down days (institutions catching falling knives).
Phase 2: Selling Climax (SC)
Final panic selling. Retail capitulates. This is where institutions buy the most. Huge volume spike on the bottom.
Phase 3: Automatic Rally (AR)
Price bounces sharply after selling climax. Institutions scale into positions.
Phase 4: Secondary Test (ST)
Price drifts back down to test the low. Key Sign: Lower volume than selling climax (institutions done buying).
Phase 5: Spring / Shakeout
Price briefly breaks below support to stop out retail traders. Institutions buy the final shares before markup.
Phase 6: Sign of Strength (SOS)
Price breaks out with high volume. This is confirmation. Institutions start markup phase.
🔴 Distribution Phase (Smart Money Selling)
The exact opposite of accumulation. This is where retail gets trapped.
Phase 1: Preliminary Supply (PSY)
After an uptrend, institutions start taking profits. Price stalls despite good news.
Phase 2: Buying Climax (BC)
Final euphoric buying. Retail FOMO at the top. Institutions dump all remaining shares. Huge volume spike at the peak.
Phase 3: Automatic Reaction (AR)
Price drops sharply. Early smart money exits. Retail says "buy the dip."
Phase 4: Secondary Test (ST)
Price rallies back to test the high. Key Sign: Lower volume (no institutional buying).
Phase 5: Upthrust / UTAD (Upthrust After Distribution)
Price briefly breaks above resistance to trap breakout traders. Institutions sell into strength. Classic bull trap.
Phase 6: Sign of Weakness (SOW)
Price breaks down with high volume. Institutions fully distributed. Markdown begins.
📈 Real Example: GME Distribution (Jan 2021)
- Jan 27: GME hits $480 (Buying Climax) - Retail FOMO at peak
- Jan 28: Drop to $120 (Automatic Reaction) - Institutions exit
- Feb 2-3: Rally to $140 (Secondary Test) - Lower volume = no institution support
- Feb 24: Spike to $200 (Upthrust) - Trapped breakout buyers
- Mar-Apr: Slow bleed to $40 (Sign of Weakness) - Full markdown
Result: Institutions sold $400+ shares to retail, who held bags all the way down.
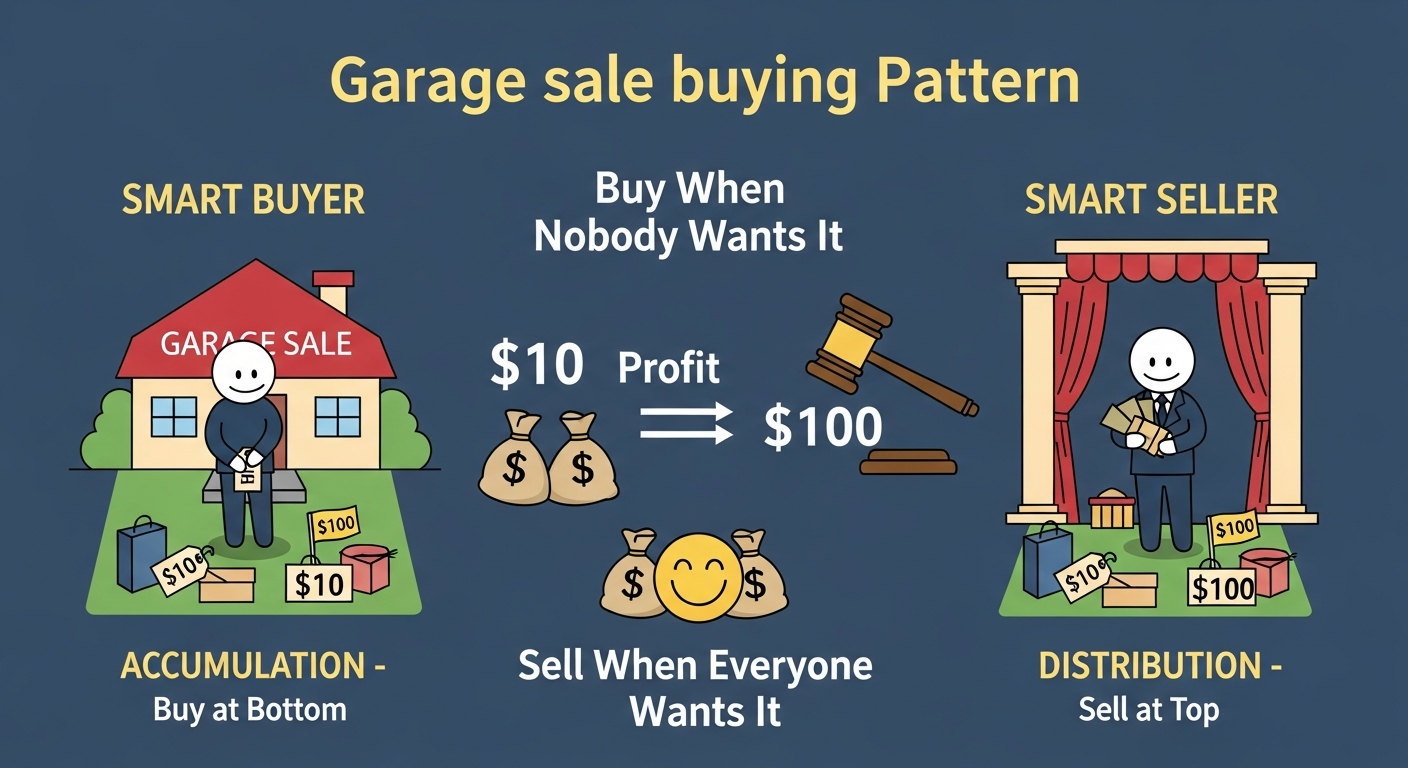
Smart money buys at garage sale prices (when nobody wants it), then sells at auction prices (when everyone wants it). Buy low, sell high!
🌊 Options Flow: Following The Smart Money
Not all options trades are equal. Institutions use specific order types that reveal their intentions.
🧹 Sweep Orders (Aggressive Smart Money)
What is a Sweep?
A sweep order fills across MULTIPLE exchanges simultaneously. This is how institutions execute large options orders without waiting.
Signal: They're willing to pay UP to get filled NOW (bullish urgency)
📊 Real Sweep Example
11:23am - NVDA $580 Calls (expires in 2 days)
- Size: $2.5 million premium
- Type: SWEEP (hit multiple exchanges)
- Above Ask: Paid $5.20 when ask was $5.05
- Signal: Institutional buyer expects NVDA to move FAST
Result: NVDA rallied $15 in next 2 hours (sweep was right)
📋 Block Trades vs Sweeps
🧱 Block Trade (Neutral/Bearish)
- Single exchange execution
- Filled at midpoint or below
- Likely a hedge or roll
- Don't blindly follow
🧹 Sweep (Bullish)
- Multi-exchange execution
- Filled above ask (premium paid)
- Directional bet
- Follow these
🎯 Unusual Options Activity (UOA)
What to Look For
- Volume >> Open Interest: Fresh money entering (not closing existing positions)
- Deep Out-of-the-Money: Lottery ticket bets = leak/rumor
- Near-the-Money with near expiration: Short-term catalyst expected
- Far dated + large size: Institution building position over weeks
- 1. Confirm sweep order (not just block trade)
- 2. Check if paid premium (above ask = urgency)
- 3. Verify volume >> OI (fresh money)
- 4. Look at underlying price action (is it confirming?)
- 5. Enter ONLY if all 4 align
📌 Max Pain & Options Pinning
Ever notice how stocks magically close right at major strike prices on options expiration days? That's not coincidence—it's deliberate.
🎯 Max Pain Theory
What is Max Pain?
The strike price where the most options (both calls and puts) expire worthless. This is where market makers lose the least money.
Incentive: Market makers actively push price toward max pain on expiration day
📊 Max Pain Example
SPY Options Expiring Today - Open Interest:
- $450 Strike: 50,000 calls, 10,000 puts
- $455 Strike: 100,000 calls, 80,000 puts
- $460 Strike: 30,000 calls, 120,000 puts
Max Pain Calculation:
- If SPY closes at $450: Calls win big (market makers lose)
- If SPY closes at $460: Puts win big (market makers lose)
- If SPY closes at $455: Most options expire worthless ✅
Expected Outcome: SPY pins at $455 by 4pm
⏰ How Pinning Works (3:45pm - 4:00pm)
The Final Push
Scenario 1 - Price is $452 at 3:45pm (below max pain $455)
- Market makers have sold 100,000 calls at $455
- If SPY stays below $455, calls expire worthless (MM win)
- Action: Market makers BUY aggressively to push SPY to $455
Scenario 2 - Price is $458 at 3:45pm (above max pain $455)
- Market makers have sold 120,000 puts at $460
- If SPY stays above $460, puts expire worthless (MM win)
- Action: Market makers SELL aggressively to push SPY down to $455
Market makers control the closing print. They will pin price exactly where they need it. Your directional bet doesn't matter—they have billions and you have thousands.
- Morning of Expiration: Check max pain strike
- If price is far from max pain: Expect drift toward it all day
- 3:45pm - 4pm: Extreme volatility as MMs force the pin
- Strategy: Sell options at max pain strike (high probability they expire worthless)
📦 Supply & Demand Zones (Where Institutions Trade)
Institutions don't trade at random prices. They build positions in specific zones, leaving "footprints" on the chart.
🟢 Demand Zone (Institutional Buying)
How to Identify
- Sharp rally away from a consolidation zone (institutions absorbed all supply)
- Low volume consolidation followed by high volume breakout
- Price didn't retrace (strong buying pressure)
- Clean base with tight range (accumulation complete)
📈 Demand Zone Example
TSLA consolidates $240-$245 for 2 weeks (low volume)
- Then explodes to $280 in 3 days (high volume)
- Never looks back (strong demand zone created)
- What happened? Institution accumulated all shares between $240-$245
- Next time price returns: Institution will defend $240-$245 zone (buyers will step in)
🔴 Supply Zone (Institutional Selling)
How to Identify
- Sharp drop away from a consolidation zone (institutions dumped all inventory)
- High volume at the top (distribution)
- Price didn't bounce back (strong selling pressure)
- Multiple rejections at same level (heavy supply)
- BUY when price returns to fresh demand zone (first touch = highest probability)
- SELL/SHORT when price returns to fresh supply zone
- Zone strength weakens with each touch (institutions filled, less interest)
- Look for confluence with VWAP, EMAs, round numbers
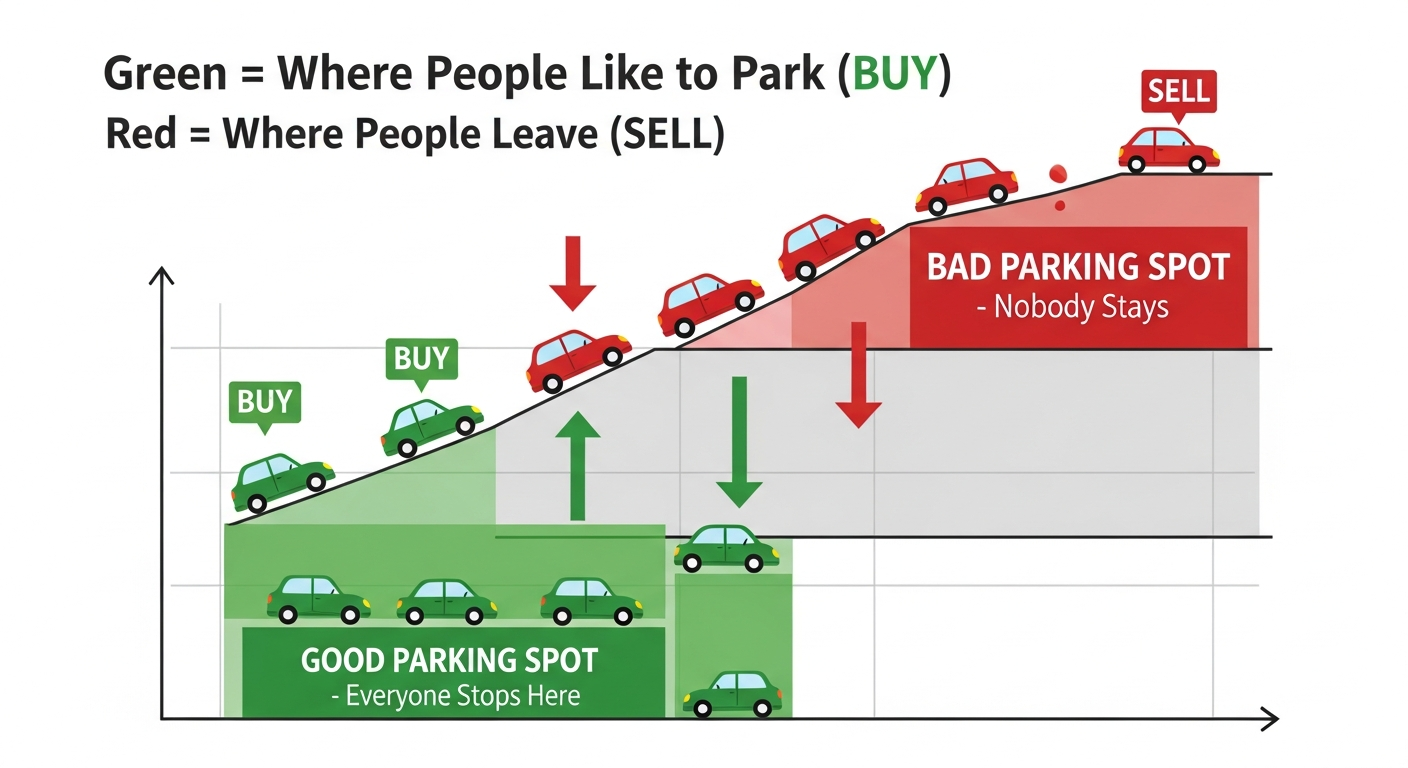
Think of favorite parking spots! Green zones = where people like to park (BUY here). Red zones = where people leave quickly (SELL here).
🎯 Putting It All Together: The Institutional Playbook
The Complete Strategy
Now you understand how institutions operate. Here's how to trade WITH them:
Step 1: Identify Accumulation/Distribution
Use Wyckoff methodology to determine if smart money is buying or selling
- Selling climax + secondary test = accumulation (go long)
- Buying climax + secondary test = distribution (go short/avoid)
Step 2: Find Supply/Demand Zones
Mark zones where institutions previously accumulated/distributed
- These are high-probability reversal points
- Fresh zones (untested) have highest probability
Step 3: Watch for Options Flow Confirmation
Before entering, wait for sweep orders confirming direction
- Call sweeps at demand zone = strong buy signal
- Put sweeps at supply zone = strong sell signal
Step 4: Monitor Dark Pool Activity
Check for large block prints confirming institutional interest
- Dark pool buying + demand zone = institutions loading up
- Dark pool selling + supply zone = institutions exiting
Step 5: Respect VWAP & Max Pain
Don't fight market maker algorithms
- If price is above VWAP and holding, institutions are buying
- On expiration days, expect drift toward max pain
🏆 Perfect Setup Example
Stock: AAPL at $175
- ✅ Wyckoff: Completed accumulation (spring + SOS confirmed)
- ✅ Supply/Demand: Fresh demand zone at $172-$174
- ✅ Options Flow: $3M call sweep on $180 strikes (2 weeks out)
- ✅ Dark Pool: 5 million share print at $174.50
- ✅ VWAP: Price holding above VWAP all session
Action: BUY $180 calls at $175 with stop below $172 demand zone
Result: AAPL rallies to $185 in 5 days (+700% on options)
Retail traders lose because they trade AGAINST smart money. They buy breakouts at the top (distribution), panic sell at the bottom (accumulation), and chase momentum (exit liquidity).
Your new mindset: Wait for institutions to show their hand, then trade WITH them.